A report is a decision document. It opens with the conclusion and its uncertainty, then gives the reader what they need to trust it or push back.
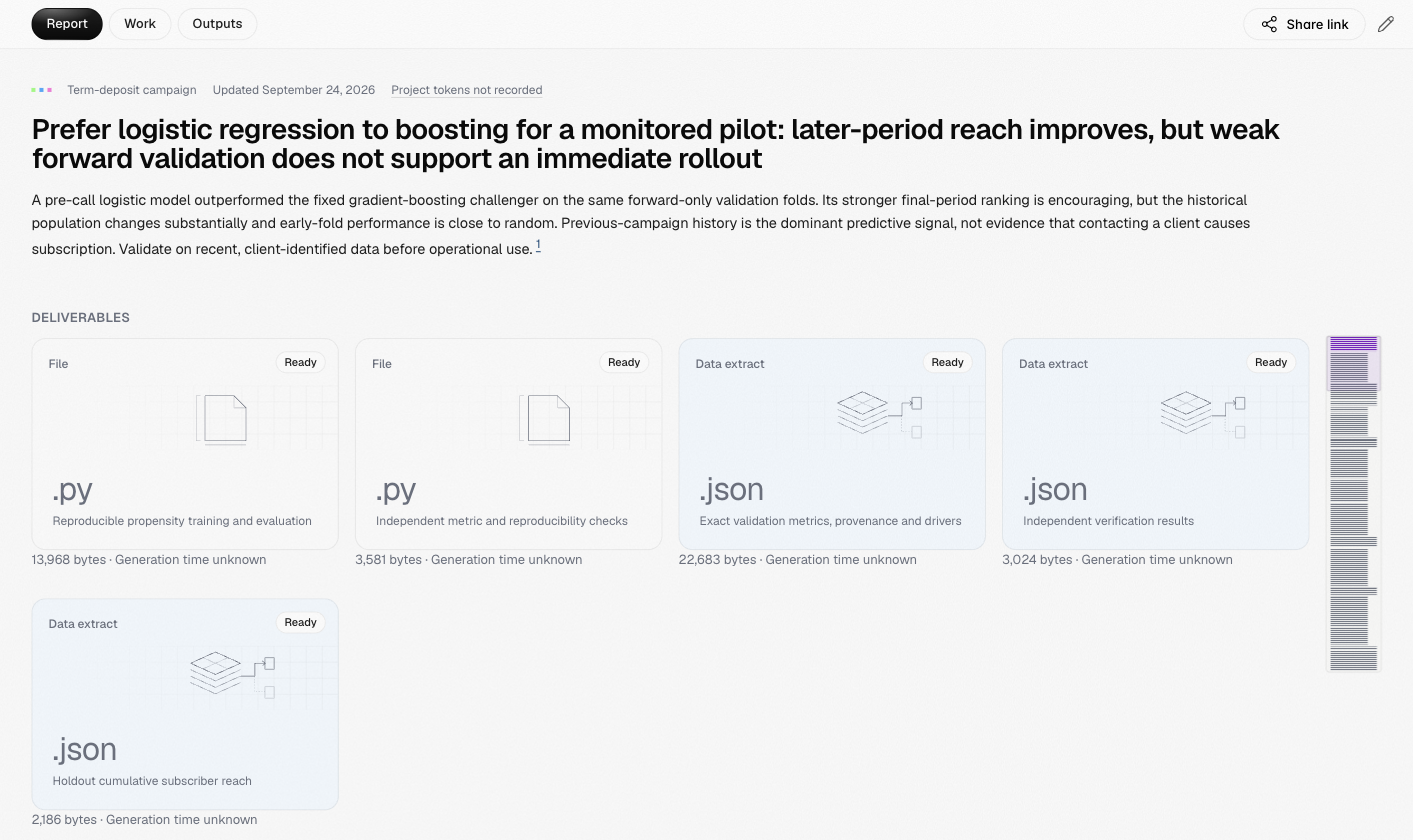
A report header: the project name, the update date and the project's recorded tokens, the headline conclusion, a summary paragraph and five deliverable cards

Reading a report

  • Header: the project, when the report was last updated and the model tokens the project’s runs recorded. On an earlier revision it also says which revision you are reading and links to the latest.
  • Headline and summary: the conclusion in one sentence, then the argument in a paragraph. Superscript numbers are footnotes.
  • Deliverables: the files attached to this revision, such as code, data extracts and notebooks. Open one to preview it in the files panel.
  • Sections: each one is a card or a set of cards: tables you can sort and filter, charts with their underlying data, key figures, questions and answers, callouts and methods.
  • Data sources: what data the analysis used, which fields, the quality alerts found, and what the data cannot support.
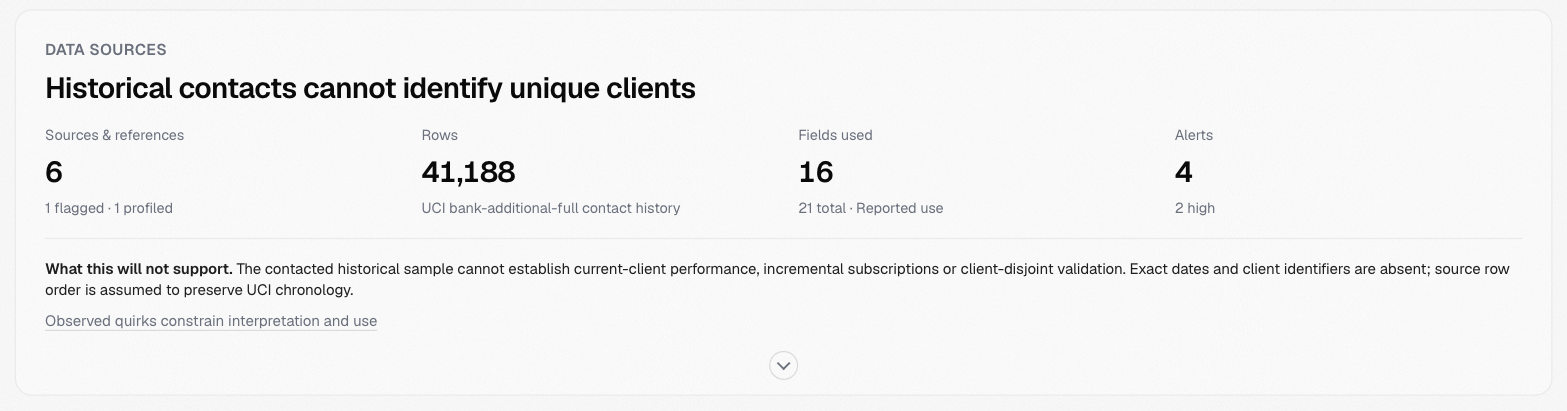
The Data sources card with counts of sources, rows, fields used and alerts, and the statement of what the data will not support
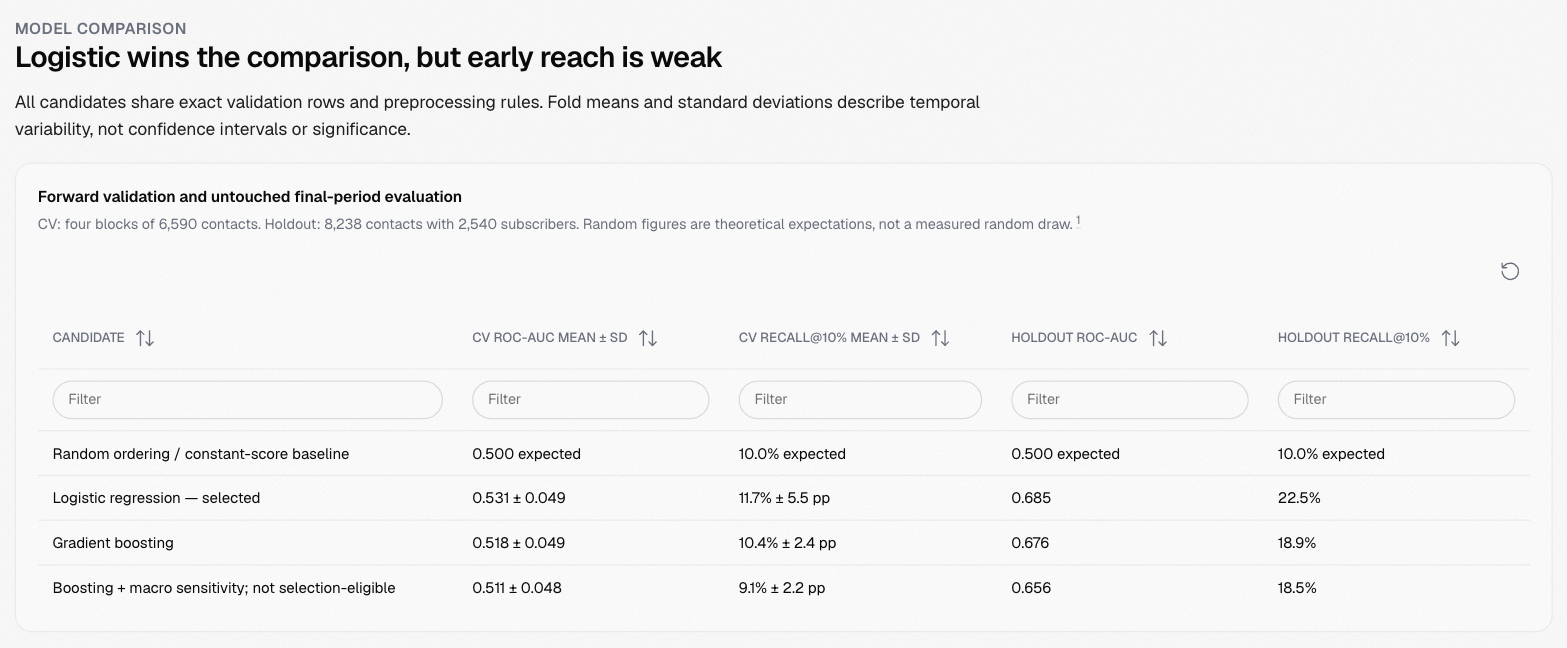
The Model comparison section: its heading and a table of cross-validated and holdout ROC-AUC and recall per model, with sort buttons and a filter box per column
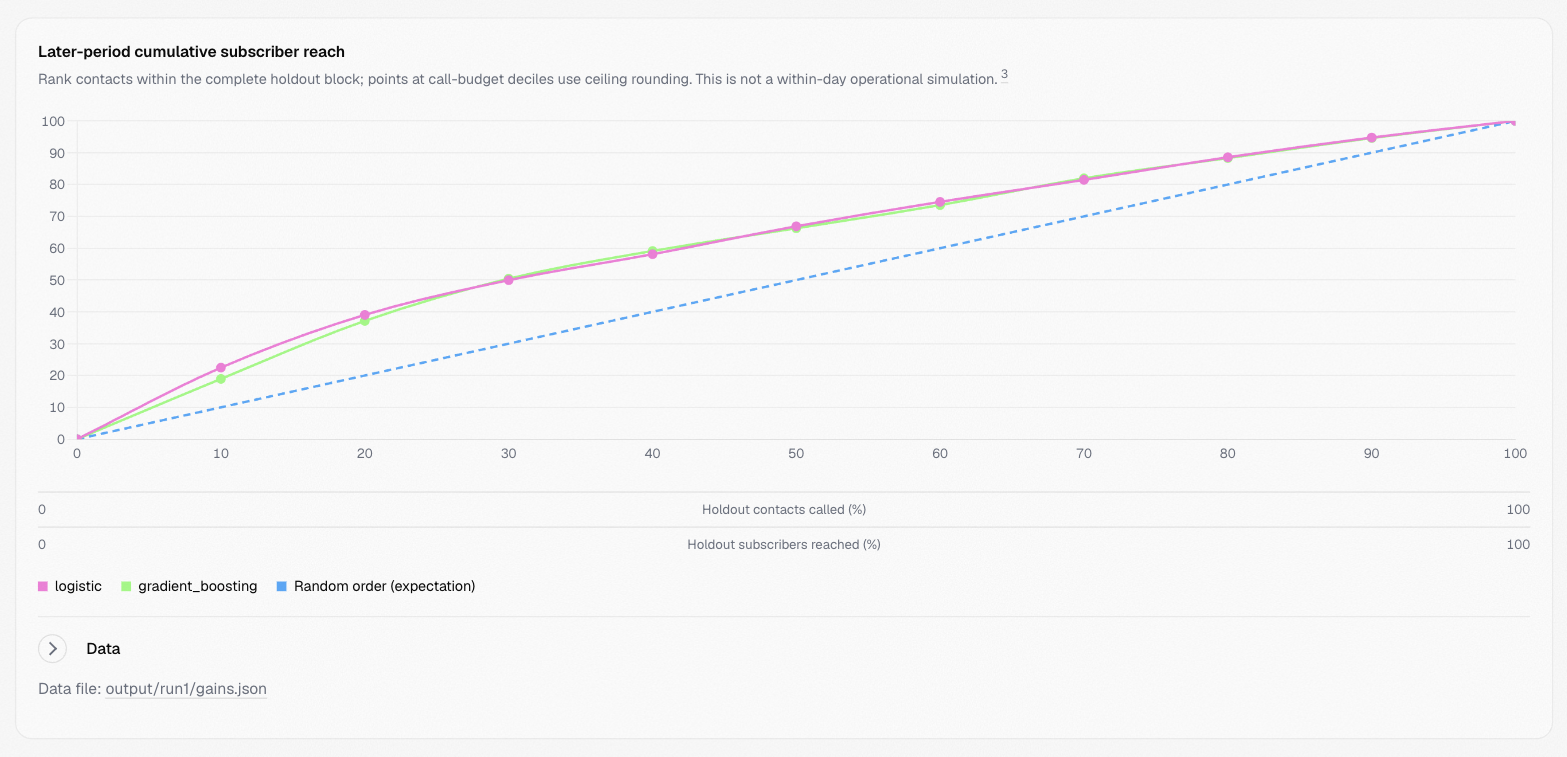
A cumulative subscriber reach chart comparing logistic regression, gradient boosting and random order, with its legend, a Data disclosure and the data file output/run1/gains.json
Every footnote points to an entry in Sources at the end of the report, and each source is a pinned revision of a file in the project. The outline at the right edge shows where you are; select a line to jump to that section.

Revisions

Publishing again from the terminal creates a new revision of the same report; earlier revisions stay readable. When a project has more than one report, a switcher above the report lets you move between them, and Outputs lists them all. Members who can write to the project can edit a report’s text from the pencil button in the header. An edit creates a new revision; it never changes a revision someone has already shared.

Printing and exporting

The ⋯ menu prints the report and exports it as an Excel workbook or a CSV dataset. When the agent authored a presentation for the report, Preview presentation opens it.